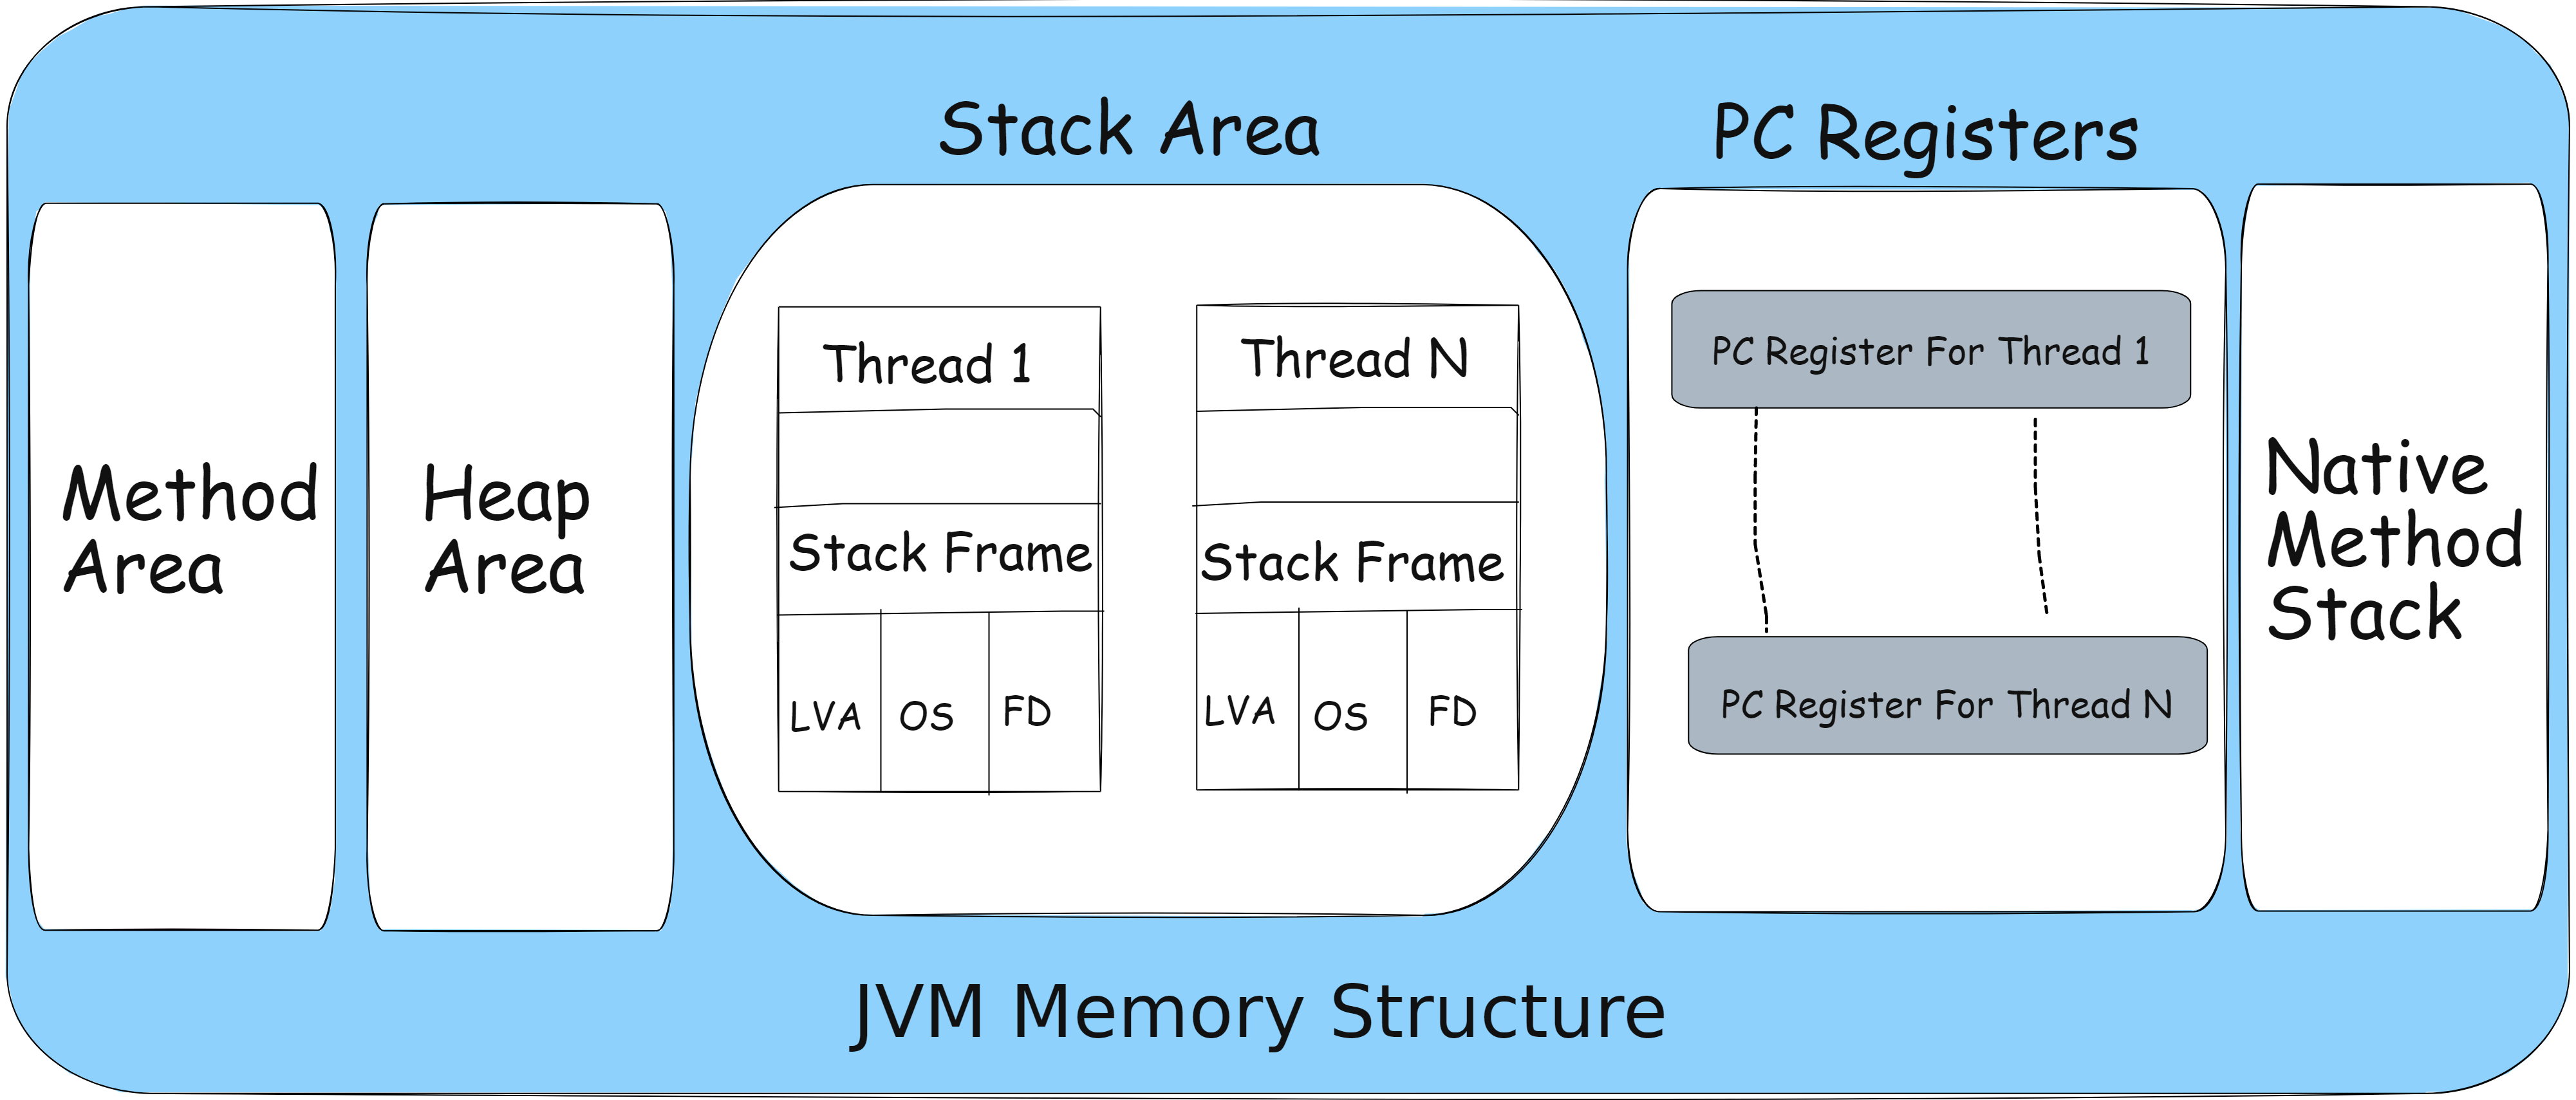
Memory Management In Java Or Memory Allocation In Java: Memory management in Java refers to the processes and techniques used by the Java programming language and its runtime environment (the Java Virtual Machine or JVM) to allocate, use, and deallocate memory during the execution of a Java program.
Memory management in Java is primarily concerned with allocating and releasing memory for objects and data structures, and it is designed to be automatic and transparent to the developer.
Why Is Memory Management Important?
While starting this Java tutorial series blog post, we mentioned that memory management is one of Java’s key features. Because Java handles memory management autonomously, requiring no direct involvement from the programmer.
The Garbage Collector takes responsibility for cleaning up unused memory, ensuring it’s released when no longer in use. So, one might wonder about the programmer’s role and why programmers should bother to understand Java Memory Management.
As a programmer, you need not concern yourself with tasks such as manually destroying objects; all credit goes to the Garbage Collector for handling this. Nevertheless, complete reliance on automatic garbage collection doesn’t cover every scenario.
Without understanding how memory management functions, you may deal with aspects of memory that the JVM (Java Virtual Machine) doesn’t manage. Certain objects fall outside the scope of automatic garbage collection.
Therefore, acquiring knowledge of memory management is crucial. It empowers programmers to develop high-performance applications that are less prone to crashes. Understanding memory management enables programmers to debug and resolve these problems when issues arise.
To better understand the Java memory management or Memory allocation in Java, you have to know two major concepts, and that is:
- JVM Memory Structure
- How Garbage Collector Works
JVM Memory Structure
The Java Virtual Machine (JVM) manages different runtime data areas during program execution. The JVM creates some, while program threads create others. The JVM’s memory area persists until the JVM exits, while thread data areas are created during thread instantiation and destroyed upon thread exit.

Let’s explore these memory areas:
Heap Area
The heap is a shared runtime data area storing actual objects in memory. It is initialized during the launch of the virtual machine. The heap size can be fixed or dynamic, depending on the system’s configuration.
JVM allows users to control the initialization and size adjustments of the heap. When you use the ‘new’ keyword, an object is allocated space in the heap, but a reference to that object resides in the stack. There is only one heap for a running JVM process.
Example:
Scanner sc = new Scanner(System.in);
In the above statement, an object of the Scanner class is created and allocated to the heap, while the reference ‘sc’ is placed on the stack. Note that garbage collection is mandatory in the heap area.
Method Area:
The method area is a logical portion of the heap established at the start of the virtual machine. It is allocated memory for class structures, method data, constructor field data, interfaces, and special methods used in classes.
The method area can have a fixed or dynamic size determined by system settings. Unlike the heap, it does not need to be contiguous. Importantly, although the method area is conceptually part of the heap, it may or may not undergo garbage collection, even when garbage collection is required in the heap area.
JVM Stacks Area
A stack is created concurrently with the creation of a thread and is used for storing data and partial results needed when returning values from methods and performing dynamic linking. Stacks can have fixed or dynamic sizes, and their size can be specified independently during creation. Stack memory need not be contiguous.
Native Method Stacks
Native method stacks, called C stacks, are not implemented in Java. Each thread is allocated native method stack memory upon its creation. Depending on the requirements, these stacks can be fixed or dynamic.
Program Counter (PC) Registers
Every JVM thread executing a specific method has an associated program counter register. In non-native methods, the PC stores the address of the current JVM instruction. In native methods, the PC’s value is undefined. The PC register can hold a return address or a native pointer on specific platforms.
Understanding these memory areas is crucial for effective Java memory management.
Garbage Collector
The JVM initiates this procedure, automatically managing memory allocation and deallocation, lightening the programmer’s load. However, garbage collection can pause other processes or threads, incurring costs.
This issue can be resolved through various garbage collector-based algorithms and a Garbage Collector tuning process that enhances program performance.
An alternative solution is generational garbage collectors, which introduce an “age” field for memory-assigned objects. As more objects are created, the list of garbage naturally expands, potentially increasing the time needed for garbage collection.
Objects are grouped based on how long they’ve survived regarding clock cycles, and an “age” is assigned accordingly. This approach helps distribute the workload of garbage collection more efficiently.
In the current landscape, all garbage collectors are generational, thus deemed optimal for memory management.
Conclusion:
Memory management in Java is a vital part of the language’s appeal. Its automatic garbage collection system simplifies memory handling, but developers must still be mindful of references and potential memory leaks. Understanding memory management is essential for creating efficient and reliable Java applications.
If you have any questions or suggestions regarding memory management in Java, please share them in the comments. Your insights can contribute to improving this aspect of Java development.
